
You probably guessed it, it’s the weight.
But how much of that weight is fat and how much of it is muscle? Losing fat is, most of the time OK, but is losing muscle just to bring that scale down OK?
The truth is that there are better benchmarks to measure like your Body Mass Index (BMI) or your waist-to-hip ratio. In other words, weight is a vanity metric.
For good or for ill, we are not a Health/ Lifestyle blog so our expertise in health and its metrics stop with this analogy. But this is where our expertise in marketing begins. And marketing, you see, has its own vanity metrics.
So, what are some of the most misused metrics in digital marketing? And which KPI is most likely to be a vanity metric? Let’s find out!
1. Social Media & Influencer Marketing
❌ Vanity metric: Number of Followers
The truth is that the total number of followers is a surface-level metric that only reflects the number of users following an account. However, this number doesn’t show many of these followers are actively engaged or interested in the content.
What’s more, it’s relatively easy to artificially inflate the number of followers through tactics like buying followers or participating in follow-for-follow schemes. Which is something we’d highly advise against.
✔️ Meaningful metric: Engagement Rate
Engagement rate, on the other hand, measures how actively your audience interacts with your content. It includes likes, comments, shares, and clicks—actions that indicate genuine interest and involvement.
This is why a smaller, engaged audience is often more valuable than a large, passive one. High engagement rates suggest that your content is resonating with your audience, leading to more meaningful connections and potential conversions.
📊 Measuring engagement rate
The formula to measure the engagement rate is as follows:

For example, if one of your posts received 200 likes, 50 comments, and 30 shares, the total engagements would be 200+50+30=280 200+50+30=280. If the post reached 5,000 people, the engagement rate would be: 280/5,000 x 100 = 5.6%
💡 But what is a good engagement rate?
You probably already know that different social media platforms have different average engagement rates. Accordingly:
- Instagram: A good engagement rate is usually between 1% and 3%
- Facebook: The average engagement rate is 0.11% for status posts, while video posts get about 0.08% and photos get 0.12%
- LinkedIn: The latest statistics show that a good LinkedIn engagement rate is around 2%
- Twitter: The average Twitter engagement rate is around 0.08%
- TikTok: Having an average engagement rate of 4.24%, TikTok is the most engaging social media platform
2. SEO
❌ Vanity metric: Organic traffic
It goes without saying that there are far more vane SEO metrics than organic traffic; SEO vanity metrics such as Domain/Authority Rating. Thankfully, fewer and fewer businesses and professionals give it more importance than once did. But the one SEO metric that still gets more stage light than it should is organic traffic.
Don’t get me wrong, organic traffic, as part of organic marketing, is a solid metric. Just not enough. Quite often, organic traffic can give the wrong impression and create problems and questions such as “How can we bring so much traffic but have so few leads”?.
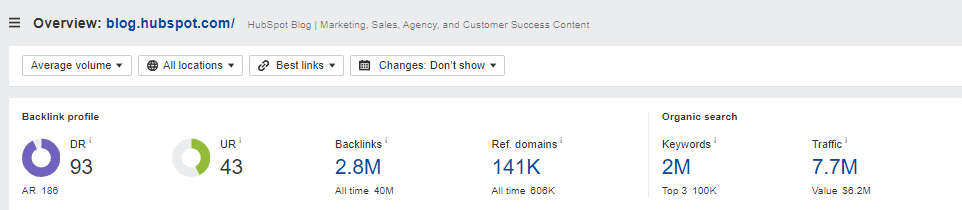
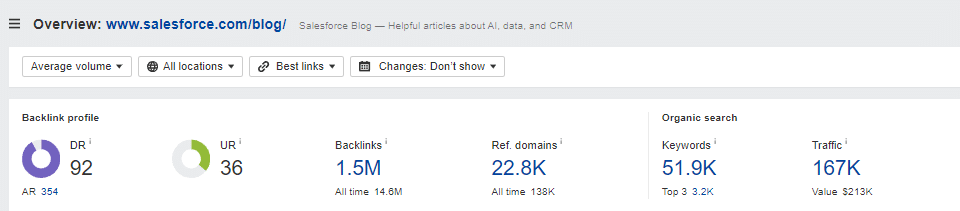
Let’s see an example: the blogs of Hubspot and Salesforce, two of the biggest CRM platforms, and compare their blogs—the place where most of their organic traffic comes from.
On the one hand, there is Hubspot. The first time we published a monthly traffic of about 7.7 million monthly users from Google.
On the other hand, there is Salesforce, which has a similar blog and 135k monthly users.
At first glance, Hubspot has more than 46X Salesforce traffic. It must also have about 46X the leads, right? Riiight?
Of course not. And through a second glance, you can see why. Under the traffic number for each blog, you can find the organic traffic value, which is also a number. In the case of Hubspot, that number is $6.2M, and $213K for Salesforce.
So, by dividing that organic traffic value by the number of users, the result is that the average Hubspot user brings this value equal to $0.8 while the average Salesforce user brings $1.3.
On a third glance, you can also understand why this is happening by looking at the top keywords each blog ranks for.
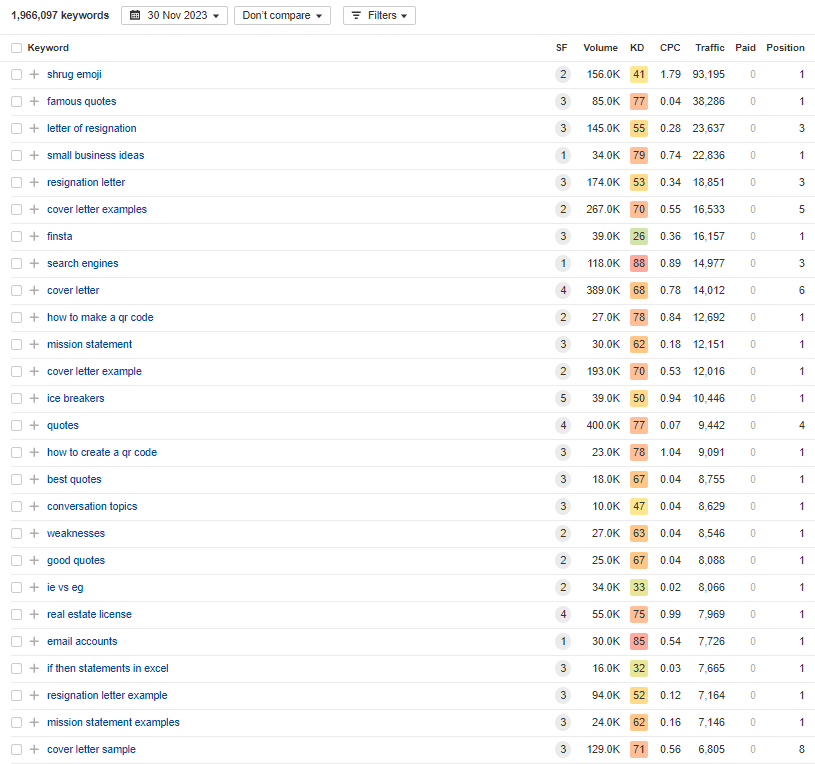
These are the Hubspot keywords with the most organic traffic:
And these are Salesforce’s:
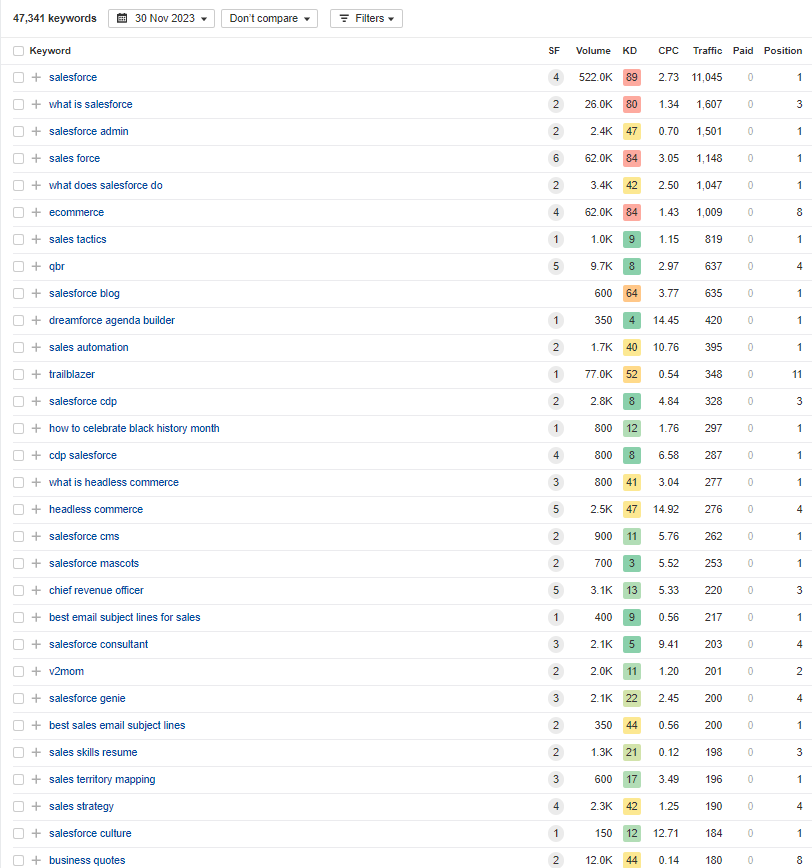
Accordingly, some of the top keywords Hubspot ranks for are “shrug emoji”, “famous quotes”, “life quotes”, “ice breakers”, “weaknesses”, and “ie vs eg”. On the contrary, Salesforce ranks for keywords such as “eCommerce”, “sales tactics”, “qbr” (it stands for Quarterly Business Review, I just googled it myself), “sales automation”, and “sales strategy”.
Now guess which of the two CRM blogs brings vanity traffic and which one brings value traffic.
You probably guessed Salesforce, and you are right.
2025 update
The metrics and screenshots you just read are from the last update of this blog post, 6 months ago.
Since then, Google’s Core and Spam Updates in December 2024 have rolled out and they made matters worse for Hubspot. Take a look at the current traffic and the change in said traffic for the two blogs:


According to these numbers, in the span of six months, Hubspot has lost more than 80% of its organic traffic. On the other hand, Salesforce has seen a significant raise in its traffic.
As with most aspects of SEO, we can only make educated guesses about why this has happened. Accordingly, our best assumptions fall into three main categories:
1. Excessive outgoing links: Hubspot’s blog linked to over 28,000 domains, with approximately 125,000 groups of similar outgoing links.
2. Content quality issues: Outdated, redundant, or thin content may have negatively impacted UX, and as a result, search rankings.
3. Diluted topical authority: In its effort to bring more traffic, the blog may have weakened its authority on core subjects, leading to diminished rankings.
To conclude, chasing traffic for the sake of traffic and over-expanding on ToFu content is not just a potential waste of resources but can also negatively impact your traffic overall.
✔️ Meaningful metric: Relevant organic traffic
I’m pretty positive that Hubspot, and any kind of marketing platform in any case, does what thinks is best for its business. What I’m trying to say is that Hubspot’s content marketing strategy is not the kind of strategy we -as an agency- would quip for most of our clients.
Creating content is expensive so creating content without considering ROI is like burning money.
All things considered, a focused SEO strategy is a more cost-effective strategy and thus brings the Customer Acquisition Cost (CAC) down. If you care about ROI, budget and money, then you should also care about bringing that CAC down.
That said, there will be times when some pieces of your content puzzle don’t always have to translate into conversions. But more often than not you should create business-related content.
The ultimate goal is not just to attract traffic but to attract the right kind of traffic that converts into business outcomes.
The two best ways to make this happen through your SEO/ content activities is through:
- Relevant keywords: Identify and target keywords that are popular and directly related to your business and its goals.
- Long-tail keywords: Incorporate long-tail keywords that are more specific to your products or services to attract more qualified traffic.
3. PPC
❌Vanity metric: Reach/ Impressions
A high reach or a large number of impressions might look impressive on paper. But it doesn’t guarantee that your ads are reaching the right audience or generating meaningful interactions. These metrics can’t show how users are responding to your ad content and the true impact of your campaigns.
At the same time, the click-through rate (CTR) isn’t good enough either. PPC campaigns come with a certain cost, and just measuring traffic doesn’t provide insights into the cost-effectiveness of your campaigns. Indeed, you may have managed to bring high traffic, but at what cost? If the cost per click (CPC) is too high and doesn’t result in conversions, it may not be a sustainable strategy.
✔️ Meaningful metric: Cost per Acquisition (CPA)
This is where CPA comes into play. Instead of just tracking clicks or visits, CPA provides a clear picture of how much acquiring a single customer or lead costs. An acquisition can be whatever is your goal—a sale, a lead form submission, a newsletter sign-up, or any other action that aligns with your business objectives.
So, by definition, CPA aligns with these business objectives, making it a more relevant metric for assessing the effectiveness of a PPC campaign.
📊 Measuring CPA
The formula to measure the CPA is as follows:

For example, if your total advertising spend is $1,000, and you generated 100 conversions through a PPC campaign, the CPA would be calculated as follows: $1,000/100 = $10
💡 But what is a good CPA?
As a rule of thumb, a good Cost Per Acquisition (CPA) is the one that brings in customers at a profitable rate. It should be high enough to maintain around 65% top-of-page impression share, yet low enough to maintain gross margins.
As a point of reference, the average Google Ads CPA search across industries currently looks like this:
Technology: average CPA of $133.52
Real Estate: average CPA of $116.61
B2B: average CPA of $116.13
Consumer Services: average CPA of $90.70
Dating & Personals: average CPA of $76.76
eCommerce: average CPA of $45.27
Education: average CPA of $72.70
Employment Services: average CPA of $48.04
Finance & Insurance: average CPA of $81.93
Health & Medical: average CPA of $78.09
Travel & Hospitality: average CPA of $44.73
Auto: average CPA of $33.52
PS. Keep in mind that CPA is not the same as CAC (Customer Acquisition Cost), which is about the cost of acquiring a new customer.
4. Content Marketing
❌Vanity metric: Pageviews
Pageviews alone do not differentiate between users who spend time engaging with your content and those who quickly click away. This vanity metric provides only a superficial measure of visibility without assessing the depth of interaction.
For example, a webpage might get a lot of clicks and traffic due to a catchy and well-crafted title or picture, but that doesn’t mean that users will find the content useful or like it. Traffic for the shake of traffic doesn’t provide real value in the end.
✔️ Meaningful metric: Conversion rate
When it comes to content marketing, there are many meaningful metrics and KPIs you can choose to measure. But if we had to choose one, that would be the conversion rate. Conversion rate measures the percentage of users who took a desired action, such as making a purchase, signing up, or downloading an item, thus (gently) pushing the user down the funnel.
If you think of it, a page was created to support a certain action, not the other way around. These kinds of actions are the reason that most content pages exist in the first place, and this is why CRO strategies are so important. At the end of the day, the conversion rate metric provides valuable insight into how well the content aligns with business goals.
📊 Measuring conversion rate
The formula to measure the Conversion rate is as follows:

For example, if a landing page received 500 visitors and 50 of them completed the desired action, the conversion rate would be: 50/500 x 100 = 10%
💡 But what is a good conversion rate?
As with any metric so far, the average conversion rate varies from industry to industry. In the same fashion, eCommerce landing pages have a conversion rate of around 5%, while real estate landing pages convert at half that rate.
That said, the average landing page conversion rate across all industries is about 6.6%, and the average landing page conversion rate per industry looks like this:
SaaS: Median conversion rate of 3.8%
eCommerce: Median conversion rate of 4.2%
Financial services: Median conversion rate of 8.3%
Health & Wellness: Median conversion rate of 5.1%
Education: Median conversion rate of 8.4%
Travel & Hospitality: Median conversion rate of 4.8%
Real Estate: Median conversion rate of 2.6%
5. Email Marketing
❌ Vanity metric: Open Rate
Open rates measure the number of subscribers who opened the email. And that’s that. A compelling subject line may lead to high open rates, but it doesn’t guarantee meaningful engagement with the email content.
Thus, open rates don’t indicate whether subscribers took any actionable steps after opening the email, such as clicking on a link or making a purchase.
✔️ Meaningful metric: Click-Through Rate (CTR)
Click-through rate measures the percentage of subscribers who not only opened the email but also took the next step by clicking on links. Thanks to this metric, you can understand whether your audience has an active engagement with the email content.
Furthermore, the click-through rate is often better directly aligned with conversion goals. The action of clicking on a link suggests a higher likelihood of taking further steps, such as making a purchase or filling out a form.
📊 Measuring CTR
The formula to measure the CTRis as follows:

For example, if you sent out 5,000 emails, and within those emails, there were 800 clicks, the CTR would be 800/5,000 x 100 = 16%.
💡 But what is a good CTR?
Here’s a breakdown of CTR benchmarks:
- Below Average: Below 1%
- Average: 1% to 5%
- Above Average: 5% to 10%
- Excellent: Above 10%
Also, according to research from Moosend, the average email click-through rate across industries is 4.01%. More specifically, the average CTR per industry looks like this:
- Government: average email CTR of 4.28%
- Media & Publishing: average email CTR of 4.7%
- Education & Training: average email CTR of 3.94%
- eCommerce: average email CTR of 2.1%
- SaaS/ Tech: average email CTR of 2.5%
Vanity Metrics – Conclusion
Make no mistake: vanity metrics are not irrelevant—they just aren’t enough.
Those kinds of metrics live in silos. They aren’t directly tied to the core objectives or KPIs that drive business success and they are not connected to the overall business strategy.
So what are your business metrics? If you want to find what your KPIs, growth metrics, and ultimate north star metric, let us know.
You can contact us here and we’ll reply sooner than you think. 🙂

I write for GrowthRocks, one of the top growth hacking agencies. For some mysterious reason, I write on the internet yet I’m not a vegan, I don’t do yoga and I don’t drink smoothies.


