
Primarily, growth metrics help you evaluate the performance of your business. They are directly related to the company’s profitability.
But let’s get a little more specific.
What Are Growth Metrics And Why Are They Essential?
KPIs and metrics are essential for every digital marketing branch.
Accordingly, email marketing has its own metrics like open rate and bounce rate.
SEO has its own metrics, too, such as domain rating and organic traffic.
Influencer marketing metrics mean that metrics like the number of impressions and engagement rate will determine the impact of your campaigns when collaborating with influencers.
The same goes for growth marketing.
In growth hacking, growth metrics are essential because they offer some crucial insights to scale up the business operations such as identifying the:
- Campaigns that deliver the highest ROI
- Number of customers who leave your business and join your competitors
- The lifetime value of individual customers
- Monthly recurring revenue every month
- Chances of success in case of business expansion
- Channels that bring in the maximum sales
In many cases, growth metrics are the opposite of vanity metrics.
Now that you have understood why growth metrics are essential, let’s examine each one of these metrics.
These are the most important metrics that startups, SaaS companies (for their SaaS valuation or otherwise), startup marketing agencies, and growth hacking agencies use day-in-day-out.
1. Activation Rate
Activation rate measures the total number of new users who have taken a pre-decided action within a specified period of time. The action taken is known to deliver the initial CV (customer value).
Here is the formula to calculate the activation rate:
Activation rate = (Users who performed a key action / total number of users) *100

💡 Example: if 500 people visited your site, and 100 of them took the desired key action in the first week then the activation rate for the first week would be 20%.
Here is how you will calculate the activation rate:
Activation Rate = (100/500) *100 = 20%
2. Annual Returning Revenue (ARR)
Annual Returning Revenue is the return on investments over a period of one year.
Here is the formula to calculate the annual returning revenue:
Annual Returning Revenue = [(Total Value of Investment – Initial Value of Investment) / Initial Value of Investment] * 100

💡 Example: if the total value of the investment is $10,00,000, and the initial investment is $8,00,000, then the annual return rate would be 25% (profit). Here is how you will calculate the annual returning revenue:
Annual Returning Rate (ARR) = [($10,00,000 – $8,00,000)/$8,00,000] * 100 = 25%
3. Monthly Recurring Revenue (MRR)
Monthly Recurring Revenue or MRR is the predictable revenue expected to be earned each month. It is used in predicting future revenue and allows for reporting the performance of the resources employed. The Net MRR gives you an idea about the revenue gains.
Here is the formula to calculate monthly recurring revenue:
Net monthly recurring revenue = Average revenue per customer * total number of accounts in that particular month.

💡 Example: if there were 10,000 accounts in January with $50 as average revenue each, the MRR would be $5,00,000. Here is how you should calculate the Monthly Recurring Rate (MRR):
Monthly Recurring Revenue = $10,000 * 50 = $5,00,000
4. Average Revenue Per User (ARPU)
Average Revenue Per User is a metric that helps investors and stakeholders determine the revenue-generating capacity of a company at the customer level. It also helps businesses to compare their performance with their competitors.
Here is the formula to calculate the average revenue per user:
Average Revenue Per User = Total Revenue Generated Over a Time Period / Number of Users During the Same Period.

💡 Example: if you generated $1000 as revenue in the year 2020 and the total users were 100, ARPU would be $10. Here is the calculation for ARPU:
ARPU = $1000/100 = $10
5. Revenue Churn
Revenue Churn is a metric that measures the lost revenue of a company over a time period. The primary reasons for revenue churns are lost contracts or cancellations, downgrades, competitive losses, and bankruptcies.
Here is the formula to evaluate revenue churn:
Revenue Churn = [(MRR at the beginning of the month – MRR at the end of the month) – MRR during the upgrades in the same month] / MRR at the beginning of the month * 100

💡 Example: if a company had $10,000 MRR at the beginning of the month, $8,000 at the end of the month, and $1,000 as the upgrades from the existing pool of customers, then the revenue churn will be 10%. Here is the calculation
Revenue Churn = [($10,000- $8,000) – $1,000] / $10,000 * 100 = ( $1,000 / $10,000) * 100 = 10%
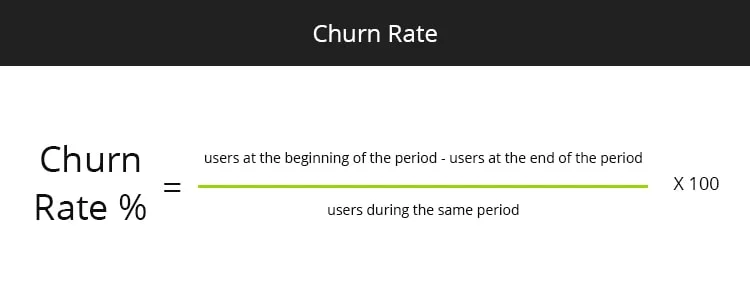
6. Churn Rate
Churn Rate is the metric that measures the percentage of subscribers or customers who either didn’t renew their subscriptions or canceled them in a given period of time.
It is one of the most crucial metrics for companies that have customers paying on a recurring basis.
Here is the formula to calculate the customer churn rate:
Churn Rate = [(total users at the beginning of the period – users at the end of the period) / users at the beginning of the period] *100
💡 Example: if you have 1000 users at the beginning of the period and 800 users at the end of the same period, then your churn rate would be 20%. Here is the calculation:
Churn Rate = [(1000-800) / 1000) *100] = 20%
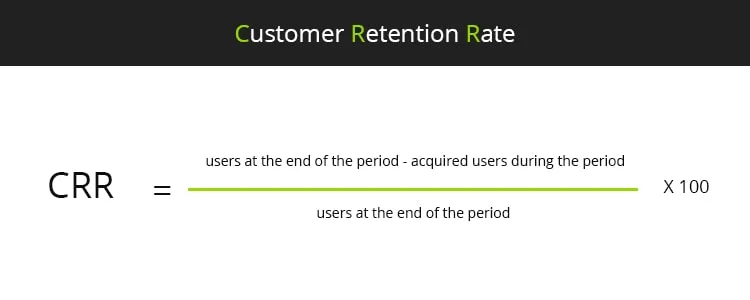
7. Customer Retention Rate (CRR)
Customer Retention Rate is the opposite of Churn Rate. Accordingly, it shows the number of clients who keep using your service/ product over a given time period.
Customer retention rate is calculated by removing the number of new customers acquired during a time period from the number of customers at the end of the period, and dividing by the number of clients at the start of the period.
💡 Example: if your company had 90 customers at the start of the period, added 20 customers over the period, and ended the period with 95 customers, then your customer retention rate would be 83.3%. Here is the calculation:
Customer Retention Rate = (95-20)/90 * 100 = 83%
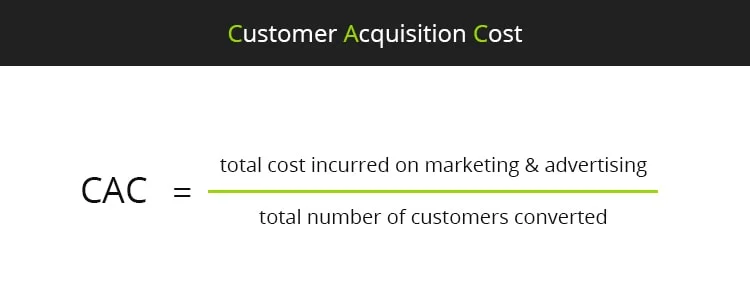
8. Customer Acquisition Cost (CAC)
Customer Acquisition Cost measures the total cost incurred on acquiring an individual customer over a determined span of time. It combines several expenses that are involved in converting quality leads into customers.
Here is the formula to calculate the customer acquisition cost:
Customer Acquisition Cost (CAC) = (Total cost incurred on marketing & advertising / total number of customers converted)
💡 Example: if you spend $100 on the marketing and advertising campaigns, and around 20 people buy the product by viewing that advertisement, your CAC would be $5. Here is how to calculate the customer acquisition cost:
CAC = $100 / 20 = $5
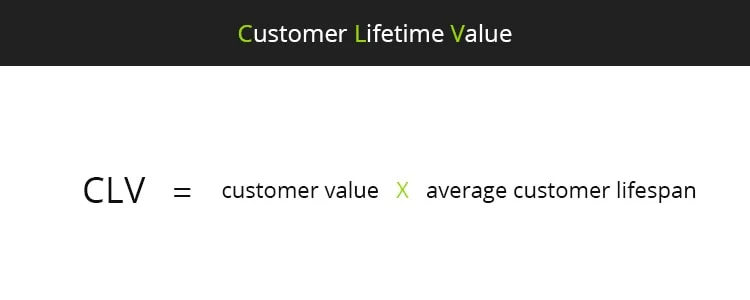
9. Customer Lifetime Value (CLV)
Customer Lifetime Value measures the total revenue a company expects from a single customer over a span of time.
Companies use the CLV metric to identify the customer segments that are valuable for their business. Needless to say, increasing your CLV should be a top priority for most types of businesses. To calculate CLV, you must have APV (Average Purchase Value) and APFR (Average Purchase Frequency Rate), CV (Customer Value), and ACL (Average Customer Lifespan).
Here are the formulas to calculate each of the above metrics:
APV = Total revenue / Number of orders
APFR = Number of purchases / Number of customers
ACL = Sum of customer lifespans / Number of customers
Customer Value = Sale price – Cost of goods sold
Here is the formula to calculate the customer lifetime value:
CLV = Customer Value * Average Customer Lifespan.
💡 Example: if the customer value of an individual is $50 per annum, and the average customer lifespan is around 10 years, the CLV will be $500. Here is the calculation:
CLV = $50 * 10 = $500
10. CLV to CAC Ratio
The CLV to CAC ratio helps you identify the efficiency of your overall business operations. For example, if your CLV to CAC ratio is 3:1 then it means that for every single dollar you spend, you will earn an additional three dollars. Furthermore, it helps the company to evaluate its most valuable customers. And thus, they can bring more than the costs incurred in acquiring them.
Here is the formula to calculate the CLV to CAC Ratio:
CLV to CAC Ratio = Customer Lifetime Value / Customer Acquisition Cost

💡 Example: if the total customer lifetime value is $1000, and the customer acquisition cost is $100, then your CLV to CAC ratio will be 10:1. Here is the calculation:
CLV to CAC Ratio = $1000:100 = 10:1
11. Lead to Customer Conversion Rate
Lead to Customer Conversion Rate is also known as lead conversion rate or sales conversion rate. This metric plays a vital role in measuring the efficiency of the sales funnel of a company.
Here is the formula to calculate the lead-to-customer conversion rate:
Lead to customer conversion rate = (Total number of qualified leads that result in sales / total number of leads) * 100

💡 Example: if your marketing campaign fetched 100 leads and only 75 leads converted into customers, then the lead-to-conversion rate will be 75%. Here is the calculation:
Lead to Conversion Rate = (75/100) * 100 = 75%
12. Net Promoter Score (NPS)
Net Promoter Score or NPS is a metric to measure the loyalty of your customers. It is based on surveys, where the targeted audience is categorized under three primary categories: promoters, passives, and detractors. The questions asked of the audience are based on subjective ratings. For instance, on a scale of 1 to 10, how likely would you recommend a service to others?
Here is the formula to calculate Net Promoter Score:
Net Promoter Score = Percentage of Promoters – Percentage of Detractors
💡 Example: while carrying out your survey to identify NPS, you have 80% of people who are the promoters, and 20% are the detractors, NPS would be 60%. Here is the calculation:
NPS = 80% – 20% = 60%
Growth Metrics – Conclusion
Regardless of whether you want to measure the performance of your online marketing campaigns or a stage in your funnel, you need to take growth metrics into account.
After building initial traction, growth should be the priority of all startups and SaaS companies. If you are in the SaaS industry, you should also keep in mind metrics such as the North Star Metric and the Rule of 40.
Do you need help defining all these metrics and making them work for you? Contact us and we’ll let you know how we can help you!

I write for GrowthRocks, one of the top growth hacking agencies. For some mysterious reason, I write on the internet yet I’m not a vegan, I don’t do yoga and I don’t drink smoothies.


2 Responses
Great Article. Its really informative and innovative. keep posting with latest updates. Thanks for sharing.
Great article. I also would add MHS(must have score), because in some scenarious this is more accurate than NPS.